
Everyone has off days
I often use data visualisation and communication appearing on the New York Times’ app and website to illustrate good aspects of data communication. NYT staff seem particularly skilled at making complex, data-intensive topics digestible. For example, they have created visualisations that crystallise the extent of climate change, and — perhaps most impressively — a podcast episode about pedestrian deaths that tells a data-intensive story without a single chart or table, but with the intrigue and suspense of a murder mystery.
In spite of this impressive track record, everyone has off days, and the New York Times itself had one recently on a day when it was trying to communicate about the stock market having an off day. That day (June 5th US time) I opened the New York Times app and saw the chart below. As shown there, the chart was in the main ‘today’ section of the app rather than the business or markets section.
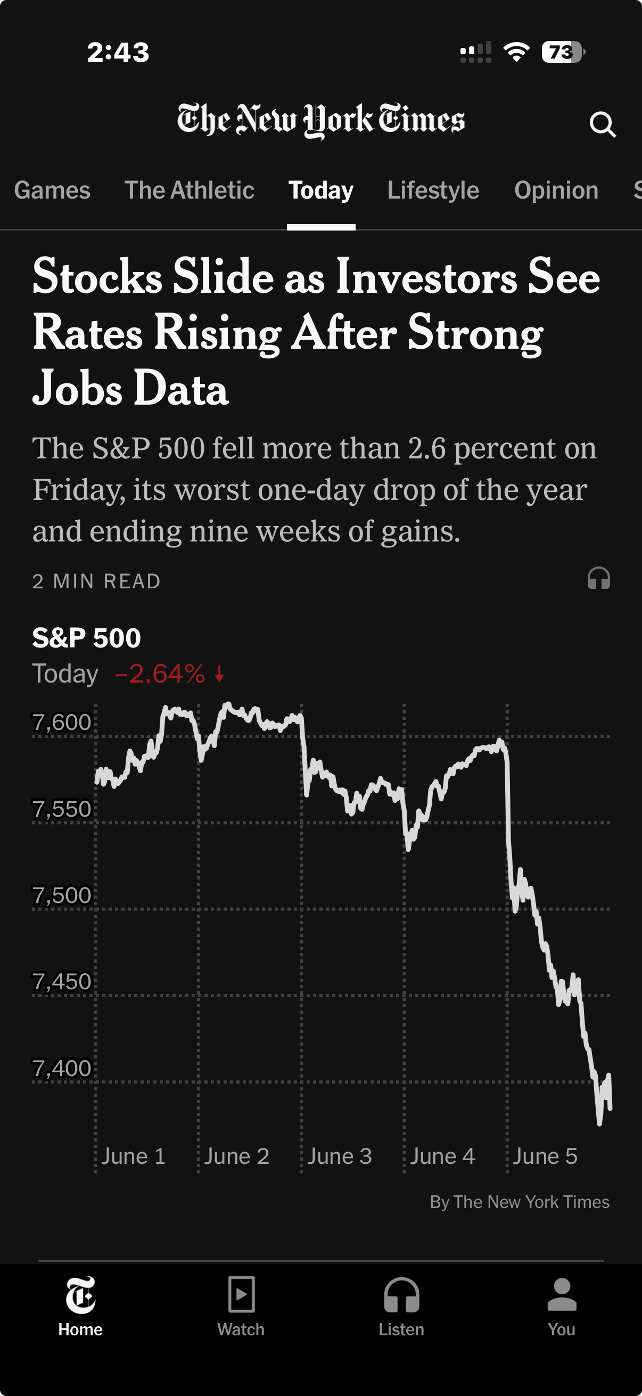
Image from the ‘today’ section of the New York Times iPhone app, 5 June 2026 (US time), reproduced for purposes of education, criticism and commentary.
Truncating axes magnifies differences
The headline describes stocks as sliding, and the graphic certainly appears to show quite a precipitous slide. But looking more closely, we can see that the axis shown only goes from about 7350 to 7650. If we look even more closely we can see the drop for the S&P 500 that day was 2.64%. That was certainly likely to be of interest, and potentially concern, to some investors, but it was a much smaller decrease than readers might have guessed looking at the graphic alone.
Generally speaking, truncating axes to exclude zero tends to magnify differences and make them appear larger than they actually are and it should therefore be avoided. That’s particularly the case because without zero there is nothing to anchor axes to and a chart the next day might use the same vertical distance to show a drop of 1.6% or a gain of 3.6%.
Those who truncate axes often intend to magnify differences, arguing that they are trying to show them clearly. For example, in this situation, they might say that starting the axis at zero and going up to 7650 or so (to include all of the data) would make the nearly 201 point drop in the S&P 500 on the 5th of June very hard to see. That’s a valid concern, but one with a better solution, as we’ll see in the next lesson.
Lesson: Include zero in axes when showing numeric data
Metric choice matters
If you asked a random sample of New York Times app users what 7,384 on the S&P 500 actually means my guess is that while many people would know it is a reflection of the collective value of large companies, few would know precisely what criteria are used for inclusion nor exactly how their value is combined into the value of the S&P on a given day. Therefore, a specific value on a given day, such as 7,384, is unlikely to mean much to them.
On the other hand, I would think most New York Times app users have a good understanding of what a 2.64% drop means. That raises a question: why don't the New York Times and others show day-to-day percentage changes rather than the index value itself? That would make it easier for people to distinguish noteworthy increases and decreases from normal day-to-day variations and long-term growth trends.
Lesson: Communicate data using the metric(s) that are most useful and intuitive to the intended target audience.
According to data from Macrotrends.net and a calculation by Claude, the S&P 500 dropped by at least 2.5% 22 times in the past five years. Showing the S&P chart as percentage changes in the New York Times app rather than the value of the S&P would have allowed viewers to see that while June 5th was a bad day in the financial markets, it wasn’t extremely uncommonly bad. Similarly, while the graphic shown by the New York Times that day wasn’t extremely uncommonly bad, it wasn’t their best data communication work either. Everyone has bad days. Even the S&P 500 and the New York Times.